Typical problem in the control of oral anticoagulant treatment.
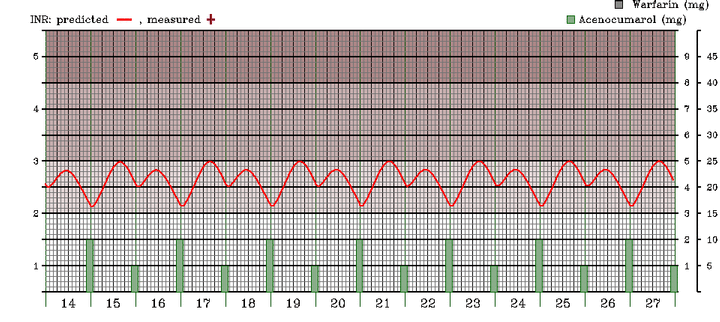
The graphic in figure 1 depicts a typical INR trend in a patient with mild sensibility to Acenocoumarol with an average daily dose of 1.5mg, given as alternated doses of 1 and 2 mg (a quarter and half a tablet of Sintrom).

Simulated INR trend in a patient receiving 1.5mg Acenocoumarol/day. Time is on the x axis. Numbered segments on the x axis represent days. Each of them is divided in four larger intervals of 6 hours each, the smallest intervals representing 2 hours each. The predicted INR value is the continuous red line; the scale for the INR is at the left. The intensity of the purple in the background is supposed to be indicative of the intensity of anticoagulation. The dose of acenocoumarol is depicted with the green bars, according to the first scale on the right.
In a real case, the INR is not monitored continuously, but a single value is determined in a blood sample at a certain instant.
Suppose the therapeutic INR range desired for the patient is 2-3 and the value that was found was 2.9.
Is the patient under an optimal schedule?
As can be seen in the graph above, it depends. If INR=2.9 and the blood sample was drawn in day 17 at about 6 o'clock in the afternoon then the management is indeed optimal.
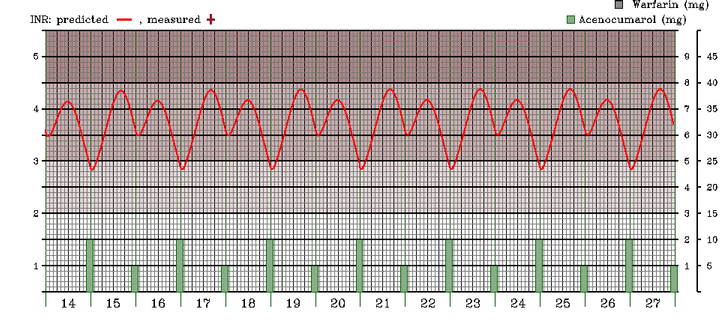
However, if the blood sample was taken at 11 o'clock in the evening of day 20, just before the patient take his half tablet, then the patient is being overtreated. His INR trend most likely looks like in figure 2.

Simulated INR trend in a patient receiving 1.5mg Acenocoumarol/day and having an INR of 2.9 right before taking the 1mg dose. Same conventions as above.
The primary clinical use of simulating the effect of the anticoagulant treatment on the INR is to illustrate the sometimes suprising relationship between anticoagulant dose and effect, which must be considered during treatment control.
To apply this in a real patient follow the steps below:
- write down the exact timing and dose given in the last few days (the more the better);
- write down the latest INR values and the exact time when they were obtained;
- enter the recorded values into the form you get by clicking on 'Simulate' above;
- Simulate (by clicking the 'Simulate' button in the form);
- adjust the CYP2C9 value until the simulated INR trend reproduces the recorded values;
- introduce the predicted drug schedule for the next week or so;
- 'Simulate' again;
- if the INR trend looks acceptable, print the result, or at least write down the code (something like 3641-D41C which appears in the top-left corner of the page);
- the predicted INR trend tells you what the expected INR value will be, in relation with the time of tablet administration, hour by hour.
*We will only use your e-mail address to answer your message.
(c) 2002-2008 A.D. Corlan


