Simulation prediction that uneven doses of acenocoumarol lead to wider fluctuations of INR, confirmed independently
An independent study by Marco F & al. [1] found that fluctuation of INR values in patients taking uneven doses (that is, different doses in different days such as 2mg and 3 mg every other day) is higher than in patients taking a fixed dose everyday.
This confirms the theoretical predictions made with the warfarissimo simulator and reported in [2] (see for example figure 9 on page 10).
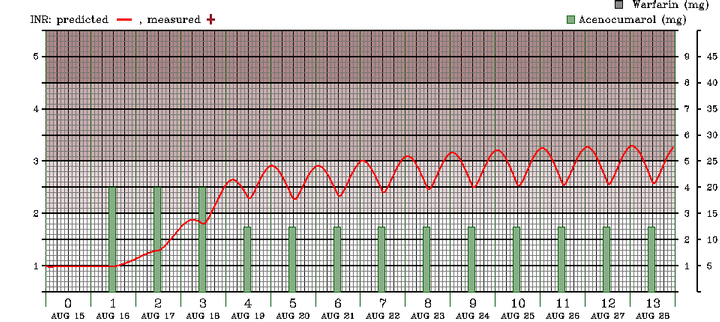
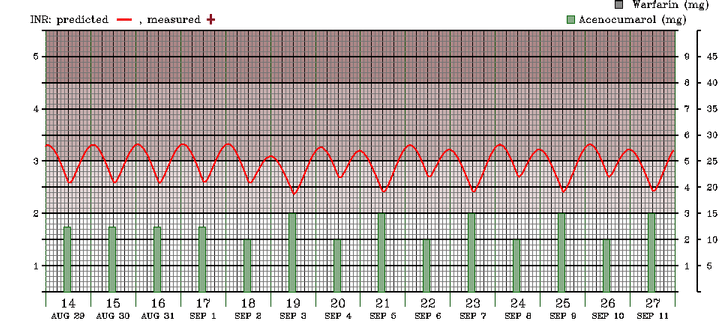
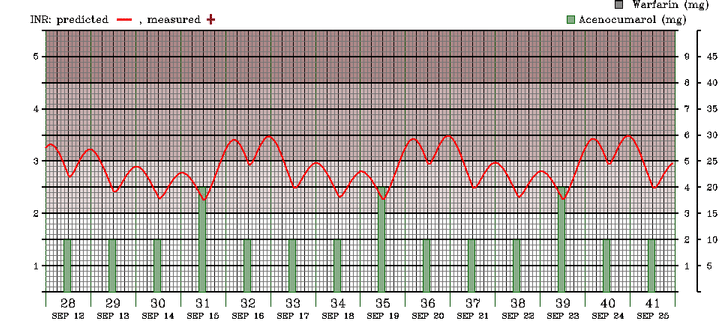
In the example below, the same average dose (2.5mg/day) was simulated in three succesive regimes, 2.5mg/day, 2mg-3mg every other day, or 2mg-2mg-2mg-4mg, in the same simulated case. The range of the INR variation changes from 0.7 to 0.9 to 1.2 respectively, although the average value remains around 3 and the daily average dose is the same.


Figure 1
Simulated INR trend in a patient receiving 2.5mg Acenocoumarol/day,
then 2mg-3mg every other day, than 2-2-2-4mg.
Time is on the x axis.
Numbered segments on the x axis represent days. Each of them is divided
in four larger intervals of 6 hours each, the smallest intervals representing
2 hours each. The predicted INR value is the continuous red line;
the scale for the INR is at the left. The intensity of the purple in the background is
supposed to be indicative of the intensity of anticoagulation.
The dose of acenocoumarol is depicted with the green bars, according
to the first scale on the right.
As explained in [1] and also shown this form was used to obtain the figures mentioned above (press [Simulate] to remake the graphics). Changing dosages, their timings and other parameters gives an ideea of what INR one might expect at what time.
[1] Patients who take uneven doses of acenocoumarol exhibit significant fluctuating levels of anticoagulation. Marco F & al; Blood Coagul Fibrinolysis. 2006 17(6): 509-12
[2] Quantitative consequences of the pharmacological model of oral anticoagulant action, explored through computer simulation A.D. Corlan & al. Terapeutica, Farmacologie si Toxicologie Clinica 2003, 7(3), 39-54.
*We will only use your e-mail address to answer your message.
(c) 2005 A.D. Corlan


