Missed dose of warfarin
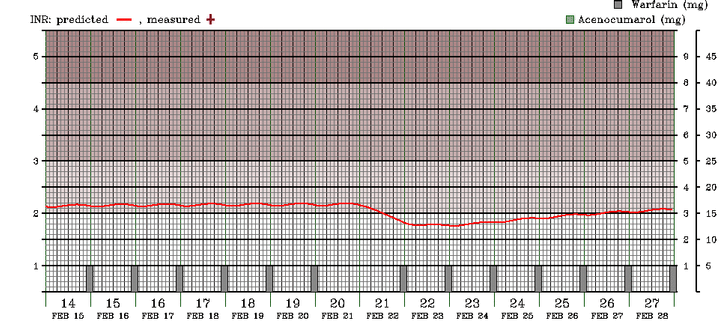
Figure 1 shows the INR dynamic of a simulated case on stable anticoagulation with warfarin with a therapeutic target of INR=2.0, of average sensibility to the drug, who misses one dose (that in day 20). This leads to the simulated case having an INR under the therapeutic target for about 72 hours.

Simulated INR trend in a simulated case receiving 5mg Warfarin/day. Time is on the x axis. Numbered segments on the x axis represent days. Each of them is divided in four larger intervals of 6 hours each, the smallest intervals representing 2 hours each. The predicted INR value is the continuous red line; the scale for the INR is at the left. The intensity of the purple in the background is supposed to be indicative of the intensity of anticoagulation. The dose of warfarin is depicted with the green bars, according to the first scale on the right.
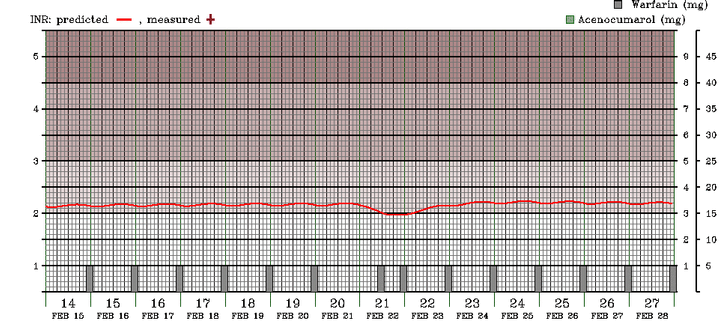
If the dose is actually taken after, say, a 12 hour delay, the reduction of the INR is much limited, unlike in the case of acenocoumarol administration.

One daily dose delayed for 12 hours.
*We will only use your e-mail address to answer your message.
(c) 2002-2008 A.D. Corlan


