

User Manual Page
In a nutshell, you enter the timing and doses of warfarin or acenocoumarol administered each day and other patient parameters in one of the online formulaires--which are linked to also from the frontpage. Then you click 'simulate' and, in about 10 seconds, you obtain a set of graphics with the simulation results. You can later use some access codes to retrieve data, graphics and reports on any simulation scenario you entered if you write down the identifier of the scenario assigned by the system.
'Every dose' form. Enter
- the weight of the patient, in kg
- the activity of the CYP2C9 enzime, which is a number between 0.0 (absent activity) and 1.0 (full activity, as in the *1*1 genotype)
- the drug given at each administration (warfarin or acenocoumarol, usually the same in all cases) and day of treatment (start with day 1), the hour and minute and the dose in milligrams.
'Regular regimen' form. The form below, entitled 'Generate new scenario' is simpler and provides for daily regular administration of the same drug. You enter the type of drug, the genotype of the simulated subject (which will specify an average value for the CYP2C9 enzyme) and the daily dose. This will generate a regimen with maintenance doses only, no 'loading'. The second 'simulate' button must be pressed in this case.
After the simulation is performed, the results are presented followed by the above formulaires, with the data completed. Thus it is easiest to enter first a regular regimen, run a simulation and then to make final adjustments to the data in the generated 'every dose' formulaire.
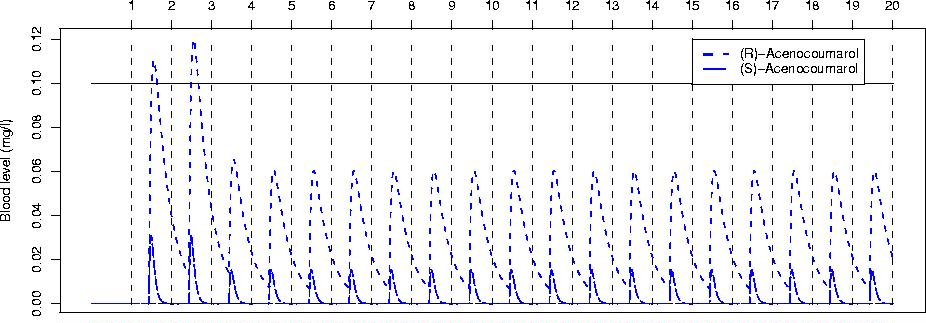
Result graphics. Four graphics are presented as results. The examples below have been obtained with a 90kg subject of CYP2C9*1*1 genotype who was given 5mg Acenocoumarol for the first 2 days and 3mg every following day, always administered at 10 o'clock in the morning. Time is on the horizontal axis, with each vertical bar representing one day.
- Blood concentration of the drug. Coumarinic derivatives have two
enantiomers, an (R)- and (S)- form (for example (R)-warfarin and (S)-warfarin).
The drugs normally administered are racemic mixtures of the two forms.
When the patient takes 1mg of warfarin she takes 0.5mg of (R)-warfarin
and 0.5mg of (S)-warfarin. Both the elimination rate and the effect
differ for the two forms Hardmann and Limbird, 2002.
Blood concentration of (R)- and (S)-acenocoumarol vs time during the example treatment.
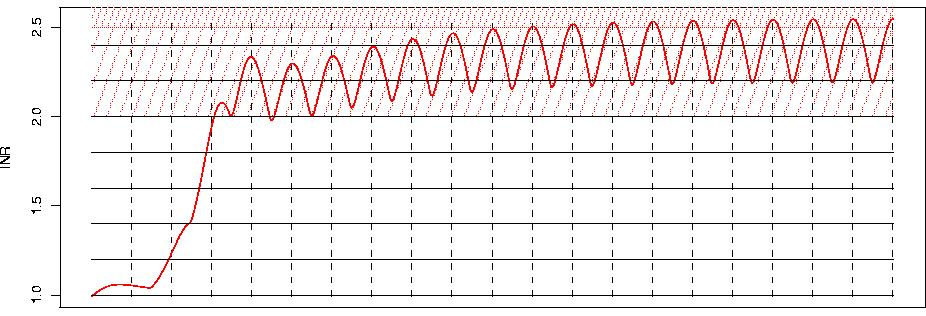
- INR The simulated evolution of the computed INR values. Patients
are not supposed to have hepatic failure and the initial level of the
coagulation factors is supposed to be normal.
INR vs time during the example treatment.
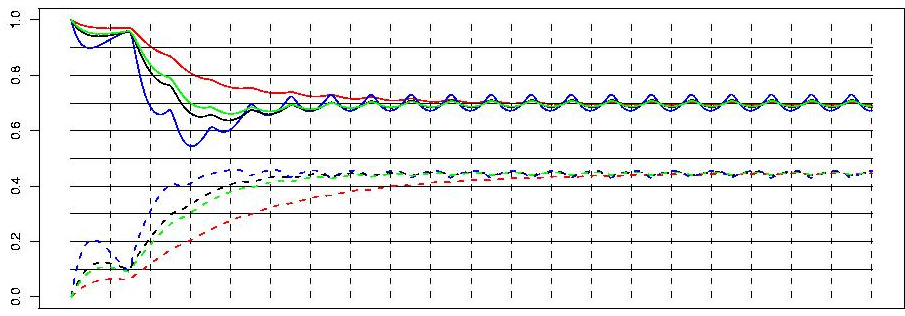
- Coumarin-dependent coagulation factors. The blood concentrations of
factors II, VII, IX and X, relative to 1.0—the normal value for each factor
is shown with a continuous line. The partially gamma-carboxylated (inactive)
fraction is shown with a dashed line. The active concentration, for each factor,
is the difference between the dashed and the continuous line of respective colour.
Coagulation factors vs time. Blue is for VII, green for IX, black for X and red for II.
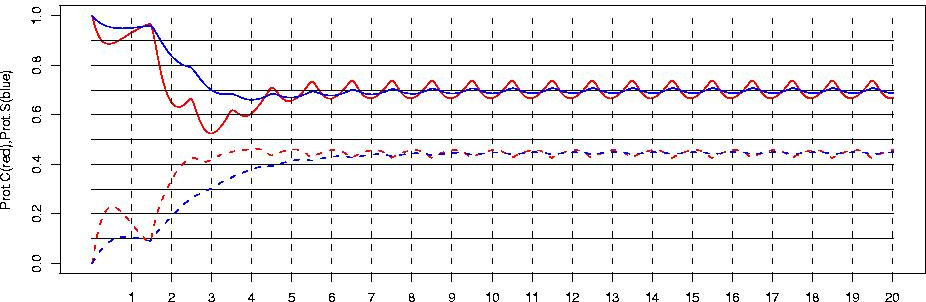
- Coumarin-dependent anticoagulant proteins. Protein-C and protein-S activities
are represented in a manner similar to the coagulation factors.
Anticoagulant protein activity vs time. Blue is for protein-S, red for protein-C.
*We will only use your e-mail address to answer your message.
(c) 2002-2008 A.D. Corlan